Identification and Analysis of Salt Responsive Candidate Gene Based on SSRs from Tomato (Solanum lycopersicum L.)- Juniper Publishers
Juniper Publishers- Journal of Cell Science
Abstract
Salinity inhibition of plant growth is the result of
osmotic and ionic effect and different plant species have developed
different mechanisms to cope with those effects. With the discovery of
molecular markers and marker assisted selection technology, it is
possible to develop markers that identify salt tolerance. This study
aimed at identification salinity responsive gene based SSRs. In this
study, genetic diversity of twenty tomato genotypes
(landraces/accessions in Nigeria) DNA of the 20 accessions were isolated
using Bioland Plant Genomic DNA protocols, Primers were designed from
15 different salt responsive candidate genes. All 15 primers sets
generated shows clear distinct polymorphic profiles as evident from the
6% agarose gel profile. Data obtained were analyzed using SSRs
polymorphic markers and Unweighted Pair Group Method with Arithmetic
Mean. The lowest polymorphic information content (PIC) value of 0.01 was
exhibited from AI486387.1 gene while highest value of 0.903 was
obtained from AI778183.1 gene with tri-nucleotide motif. The dendogram
generated shows two clusters, one containing only the accessions and the
other one containing both landraces and accessions. In conclusion, the
present study represents the potential of salt responsive candidate gene
based SSR (cgSSR) markers to be utilized as remarkable candidate for
diversity analysis among tomato genotypes differing in salinity response
and the genetic distance information reported in this study might be
used by breeders when planning future crosses among tomato genotypes.
Keywords: Tomato; Salinity; DNA; Polymorphic information content; Candidate gene
Introduction
Tomato (Solanum lycopersicum L.), belong to the
Solanaceae family which is one of the most important vegetables being
widely grown in both fields and under protected cultivation. Most tomato
cultivars are sensitive to moderate levels of salinity [1]. Indeed, all
plant development stages, including seed germination, vegetative growth
and reproduction, show salinity sensitivity, that leads to poor
harvests and reduced economic yield [2]. Tomato is considered as a
vegetable model and has thus been subjected to molecular investigation
resulting in abundant genomic information. In addition to its worldwide
agricultural and economic importance as a crop, tomato is a pre-eminent
model system for genetic studies in plants. The use of molecular markers
in breeding by means of marker assisted selection (MAS) could improve
performance under extreme environments [3].
Tomato (Solanum lycopersicum L.), a major
horticultural crop consumed all over the world, suffers heavy losses due
to salinity. USP (universal stress protein) family proteins, first
identified in prokaryotes, appear to play an active role in abiotic
stress response, but their function remains largely unknown in plants
[4]. A USP gene (SpUSP), cloned from wild tomato (S. pennellii) and
functionally characterized in cultivated tomato exhibited increased
expression under dehydration stress, salinity, oxidative stress and
phyto-hormone ABA treatment. With the discovery of molecular markers and
marker assisted selection technology, research has entered in to a new
era and has made it possible to develop new and more informative
PCR-based markers, including simple sequence repeats (SSRs), and to
further facilitate the use of markers in tomato breeding. Genomic
microsatellite markers are an elite group of markers, but there is
possible uncertainty of linkage with the important genes. In contrast,
there are better possibilities of linkage detection with
important genes if SSRs are developed from candidate genes [5].
Deoxyribonucleic acid (DNA) polymorphisms provide a
powerful tool for quantifying the existing levels of genetic
variation in plant germplasm [6]. Molecular markers can
provide an effective tool for efficient selection of desired
agronomic traits because they are based on the plant genotypes
and thus, are independent of environmental variation. It is
suggested that the variation or polymorphism of SSRs are as a
result of polymerase slippage during DNA replication or unequal
crossing over [7]. SSRs are not only very common, also are hyper
variable for numbers of repetitive DNA motifs in the genomes of
eukaryotes [8,9]. Development of SSR markers based on QTL or
candidate genes related to an important agronomic trait is useful
in marker-assisted breeding programs for the concerned trait. In
line with this, SSR markers were combined with morphological
traits to assess the genetic diversity of cultivated and wild
tomatoes [10]. The use of molecular markers can facilitate
tomato breeding by means of marker assisted selection (MAS) to
improve agronomical important traits such as yield, fruit quality,
and disease resistance.
Materials and Methods
Plant materials plant materials

The seeds of the selected landraces tomato accessions
were obtained from local markets around Sokoto and Zamfara
metropolis and the released cultivars seeds were obtained from
Zamfara State Agricultural Development Project, Gusau and
Indian Agricultural Research Institute (IARI), New Delhi. A total
of 20 genotypes of tomato grouped into landraces and released
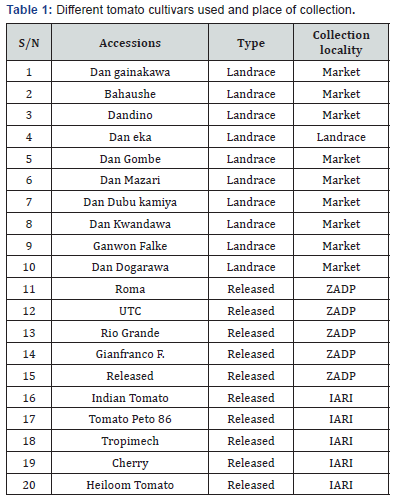
were used for the diversity analysis. The collection locality, type
and common name of each cultivar are summarized in Table 1.
Isolation of genomic DNA
The DNA was isolated following a protocol of Bioland Plant
Genomic DNA. Fresh green leaves were collected from twenty
selected tomato plant samples and weighed (100mg), in 2.0mL
micro centrifuge tube and immediately 600μl Buffer PL. 1 was
added. The samples were then incubated at 65 °C for 10 minutes.
The samples were mixed twice during incubation by vertexing
the tube, 2μl of RNase A to remove RNA. Thereafter, 140μl Buffer
PL. 2 was added and mixed by vertexing for 10 seconds and
centrifuge at 11,000 rpm for 10 minutes. The supernatant was
carefully transferred to a clean 2.0mL tube. Then 0.7 volume
of isopropanol was added and mixed by vertexing for 5 second
and centrifuge at 12,000rpm for 2 minute to precipitate the
DNA. The supernatant was carefully decanted and discarded.
Moreover, 300μl of elution Buffer (Pre heated) was added and
vortexed for 10 second to mix the DNA well. Then 150μl of Buffer
PL. 3 and 300μl of ethanol ware added and mixed by vertexing
for 5 second, the samples were transferred into column and
centrifuge at 11,000rpm for 1 minute. Therefore, 600μl of DNA
washed Buffer was added and centrifuge at 11,000rpm for 20
second and the flow through was discarded. The column was
transferred to a clean 1.5mL tube and pre-warmed (65 °C)
100μl elution buffer was added and immediately centrifuged at
11,000rpm for 1 minute to elute the DNA. The eluted DNA was
added back to the column for second elution.
Retrieval of salt tolerant gene sequences, simple sequence repeats detection and primer design
Nucleotide sequences conferring salt tolerance in tomato
were downloaded from National Center for Biotechnology
Information (NCBI). The downloaded nucleotide sequences
were used to mined simple sequence repeats [11,12]. The gene
sequences were used to mined SSRs in SSR identification tool
[13]. Respective references of those candidate genes which have
been found to contain microsatellite repeats were used. Primers
was designed manually with the following parameters: primer
length 18-30bp, melting temperature 50-60 °C, GC percentage
40-60 and product size- 160-500bp using Vector NTI software.
Pcr amplification and 3% agarose gel electrophoresis
PCR amplification was perfumed on 20 genotypes with 15
pairs of SSR primers in a total volume of 25μl using a C1000
Thermal Cycler (Bio Rad, USA). Each 25μl volume of reaction
mixture contained 50ng of genomic DNA as template, 1X Taq
polymerase buffer, 2mM MgCl2, 0.2mM dNTPs mix, 0.4pM each
of the forward and reverse primer, 1 U of Taq polymerase. The
optimized condition was initial 5 minutes incubation at 97 °C for
complete denaturation, followed by 38 cycles consisting of 94 °C for 1min, 55 °C- 60 °C (vary with the primer pair) for 1min, 72
°C for 2min and finally 72 °C for 10min. The experiments were
repeated twice. Resolving of all PCR products were performed in
a vertical non-denaturing 3% Agrose gel electrophoresis system
at constant 90V with 1X TAE (Tris acetate EDTA) buffer (pH-
8.0). The gel was stained with ethidium bromide solution and
visualized in gel documentation system (Protein Simple, USA)
according to [14].
Allele scoring
Molecular weights of the amplified bands were determined
by the number of base pair were multiplied by the average
molecular mass of one base pair (660g/mol) to get the
approximate mass of the whole double-stranded DNA molecule.
Molecular weights of the amplified bands were determined
based on the relative migration of standard 100bp DNA ladder
(Thermo Scientific, USA) in the gel. Presence and absence of
a particular allele was denoted as 1 or 0 respectively. Allele
exclusively found in one genotype, it was designated as unique
allele, in less than 5% of genotypes were designated as rare [11].
Data analysis
Polymorphism information content (PIC) value of each
primer pairs was calculated according to the formula: PIC =
1- Σ pi-2, where pi is equal to the frequency of the allele of a
particular locus [14] The dendrogram was generated using
Unweighted pair group method analysis (UPGMA).
Result
Allelic variation among the polymorphic simple sequence repeat loci
A total of 144 alleles were detected including 2 rare alleles
with no unique allele. The cgSSR from XM_010323394.1
gene produced the lowest number of 4 alleles, followed by
NM_001287774.1, AI486387.1, AY562123.1 with 5 alleles. The
cgSSR from AI773078.1 gene gave rise to the highest number
of alleles (19). In this research, only di-tetra nucleotide repeats
and reiteration of motifs less than 5 times was excluded. Di
-nucleotide motifs were found to be the largest with 175 SSR
loci and tetra-nucleotide motifs formed the smallest group with
48 SSR loci (Figure 1). List of those genes with SSR loci with
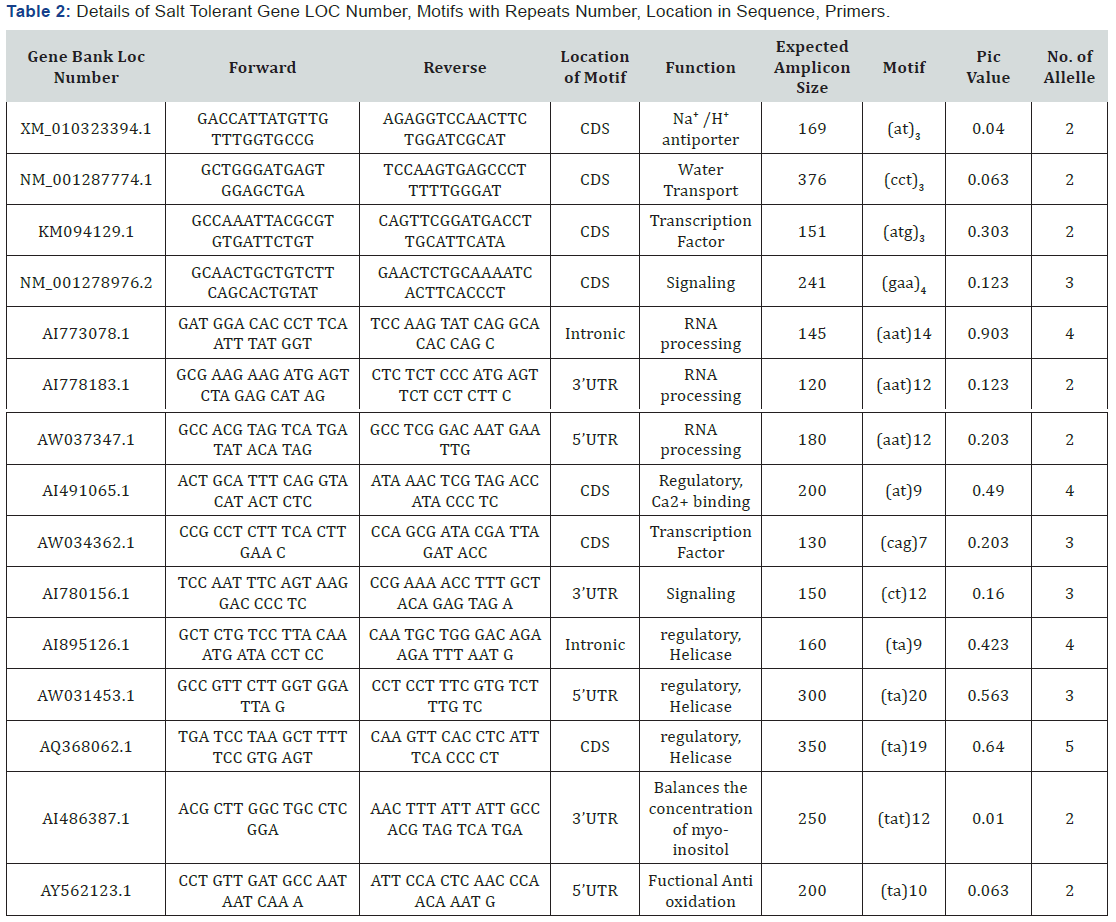
their respective gene bank LOC number, function, number, types
and location of motif found were detailed in Table 2. Out of the
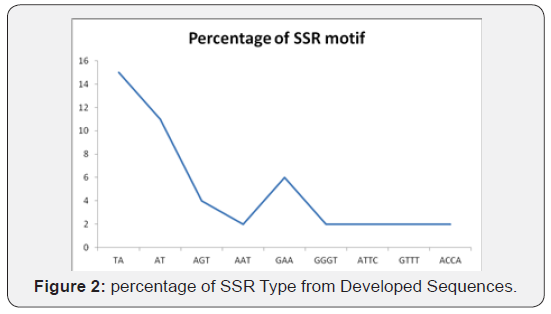
different kinds of motifs found, TA motifs (38.9%) were most
frequent, followed by AAT (25%) and AT, TAT and CT (8%) motif
(Figure 2).


Type of simple sequence repeats, number of repeats and number of nucleotide per repeat
The sequences from the twelve randomly selected alleles
were inserted in to simple sequence repeats identification tools,
to identify and analyzed the SSR types, number of number of
repeats and number of nucleotide per repeats. To validate the
present gene with the original candidate genes. Di-nucleotide
recorded the highest number of 78 repeats followed by trinucleotide
with 55 repeats and tetra-nucleotide with 5 repeats.
The highest percentage of 15 SSR motif was found in TA followed
by AT with 11 SSR motifs. The lowest percentage of 2 SSR motifs
was found in GTTT, ATTC, TTTG and ACCA respectively (Figure
2).

Simple sequence repeats markers characterization based on salt responsive gene
All the 15 different primer sets amplified to different
respective cgSSR loci among tomato genotype and were used
in the analysis of genetic diversity among the selected tomato
genotypes (10 accessions and 10 landraces genotypes). Primer
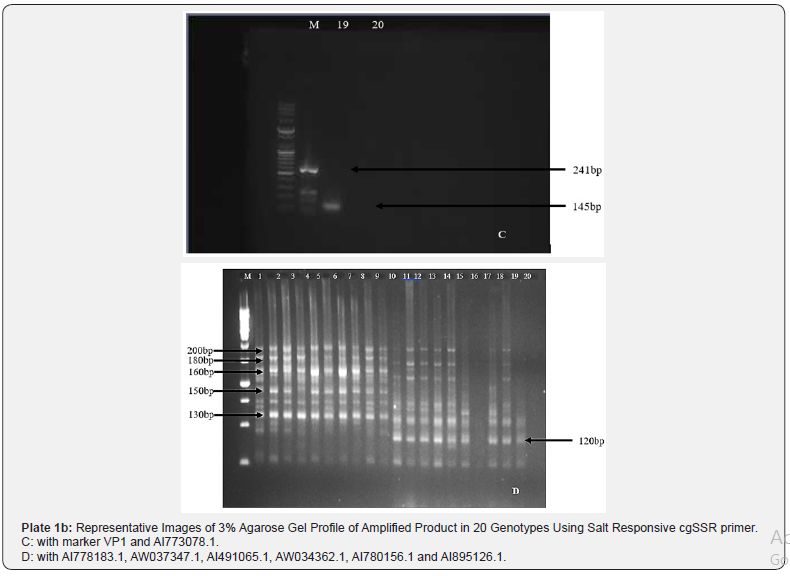
sets generated clear distinct polymorphic profiles as evident
from the 3% agarose gel profile (Plate 1a & 1b). A total of 144
were detected by these polymorphic markers and the PIC value
denotes the allelic diversity and frequency among genotypes.
The lowest PIC value of 0.010 was exhibited by the cgSSR from
AI486387.1gene, while highest value of 0.903 was obtained
with the cgSSR from tri-nucleotide motif of AI773078.1 gene.
Primer designed from di-nucleotide motif loci of XM_010323394
had lower PIC value of 0.040. Details of primers and their
corresponding PIC values were presented on Table 2.

Genetic diversity analysis based on SSR
The data matrix generated from 15cg SSRs profiling of 20
genotypes were utilized to study the genetic diversity by cluster
analysis. The dendrogram generated through unweighted pair
group method of arithmetic mean (UPGMA) showed the similarity
among the tomato genotype. The dendrogram exhibited four
distinct clusters, interestingly none of the genetypes from
different panel (i.e accessions and landraces) intermixed with
one another (Figure 3). It was observed that dandino, dan
kwandawa, dan mazari, dan eka and dan dubukamiya having
same collection locality formed a separate subgroup. However,
the same pattern of distinct subgroup was obtained under a
subgroup with UTC and UC82B accessions. It is distinct from
the genetic diversity analysis using the 15 cgSSR markers that
those markers are able to distinguish tomato genotypes on the
basis their genetic diversity based on salinity responsive genes
(Figure 3).
Discussion
Allelic variation among the polymorphic simple sequence repeat loci of salt responsive gene
An average polymorphic information content of 0.287 and
allelic variation observed might be correlated with the number
of repeats within a particular microsatellite locus. Smulder et al.
[15]and He et al. [16] reported a positive relationship between
the number of repeats and the PIC value of tomato screened using
SSR. The gene AI486387.1 had lower PIC (0.01) with 12 repeats
compared to AI780156.1 which has PIC of 0.16 with 12 repeats. Similar observation was reported by He et al. [16] with genes
with the same number of repeats but has different PIC value in
Lycopersicum esculentum cultivars. Most of the tri- nucleotide
motifs were found in CDS, in this respect, the result of this study
is in agreement with an earlier report in inbred tomato with
57% tri-nucleotide found in CDS followed by 5´UTR with 21%
(39). The phenomenon of conspicuous of tri-nucleotide repeats
in CDS could be attributed to the selection pressure against
frame shift mutation in coding regions resulting from length
changes in non-triplet repeats [17]. In this study, TA repeat
was the most-frequent type of SSR in the genotype, followed by
AAT repeat. Wang et al. [18] reported the most-frequent type of
microsatellite repeat as the AT/TA repeat. This shows that AT/
TA motifs are most frequent in tomato salinity responsive gene;
in this regard breeding tomato with this motif may alleviate the
effect of salinity in tomato production.

Phylogenetic analysis of tomato using simple sequence repeats markers
In the phylogenetic analysis, most of the tomato landraces
and accessions were clustered together in respect to their
genetic variation in response to salinity responsive gene and
might have a similar genetic background. Those clustered within
the same group or subgroups are mostly from the same origin
and those, which are distantly grouped, might be genetically
distinct. The relationship was also observed in similarity of the
landraces genotypes in terms of their growth habit. In group
IV, Bahaushe, Dandino and Dan eke are from the same location
and exbited same growth habit. Similar result was reported on
tomato. Cultivars from same geographical locations were group
in a cluster of the dendrogram.
Conclusion
However, SSR based dendrogram showed clear relationship
among the two panels (i.e accessions and landraces) in group
I. interestingly, none of the landraces intermixed with the
accessions in a sub group. This could help to improve genetic
diversity analysis in tomato and the markers obtained could
be used in a wide range of identification and pre-screening for
salinity responsive gene in tomato.


Comments
Post a Comment